Contents
Subscribe to our newsletter
Subscribe to the elia newsletter for exclusive product updates and industry best practices. You can unsubscribe at any time.
Thank you! You're subscribed.
Oops! Something went wrong while submitting the form.

.png)
.png)
We've watched office space transform dramatically over the past few years. The hybrid work revolution has fundamentally changed how organizations think about their real estate, and suddenly, the desks sitting empty on Tuesday mornings represent thousands of dollars in wasted potential. Desk occupancy, the measurement of how many workstations are actually in use at a given time, has become one of the most essential metrics for modern workplace management.
Understanding your desk occupancy isn't just about counting bodies anymore. It's about making data-driven decisions that can reduce your real estate costs by 30% or more while simultaneously improving the employee experience.
Let's clear up a distinction that trips up many workplace managers. Desk occupancy tells you what percentage of desks are in use right now, a snapshot of your office at a specific moment. Desk utilization, on the other hand, measures how effectively those desks are used over time, tracking patterns across days, weeks, or months.
Think of it this way: occupancy is the photograph, utilization is the time-lapse video. You might have 60% desk occupancy during peak afternoon hours but only 35% utilization when measured across an entire week. We find both metrics crucial for different decisions. Use occupancy data to determine immediate space needs and identify peak times. Turn to utilization metrics when planning long-term real estate strategies or calculating your ideal desk-sharing ratio.
For a deeper exploration of usage patterns over time, check out our guide on desk utilization monitoring.
Desk occupancy is not a vanity metric. It directly affects cost, experience, and strategy.
According to global workplace reports, average desk occupancy in hybrid offices often sits between 40% and 60%, far below traditional assumptions.
The basic desk occupancy rate formula is straightforward: (Number of desks in use / Total number of desks) × 100. If your office has 200 desks and 120 are occupied at 2 PM on Tuesday, your occupancy rate is (120 / 200) × 100 = 60%.
What constitutes a "good" rate depends entirely on your work model. For hybrid offices, we typically see healthy occupancy rates between 40-60%, allowing for schedule flexibility and avoiding the frustration of full offices during peak days. Traditional offices might target 70-80%, though anything approaching 100% creates problems. You need buffer capacity for visitors, new hires, and schedule variations.
Calculating occupancy at different intervals reveals different insights. Hourly calculations show you when people arrive and when the afternoon exodus begins. Daily and weekly tracking helps you spot trends over time, like the notorious Monday and Friday attendance drops. The market value of this data lies in identifying trends that inform future decisions about space allocation and workplace policies.
Some organizations still rely on manual methods like spot checks, where facilities managers walk through the office counting occupied desks. Badge swipe data provides a rough count of who's in the building but doesn't tell you where they're sitting or whether they're actually using a desk versus camping in meeting rooms all day.
These approaches have obvious limitations. They're time-consuming, prone to error, and provide no real time data. We only recommend manual methods for very small offices with fewer than 20 desks where automated systems outweigh the benefits.
Modern occupancy sensors provide the backbone of accurate desk occupancy monitoring, delivering real-time data while respecting employee privacy. Here are the main types available:
Privacy considerations remain paramount across all sensor types. Every solution we recommend avoids cameras, never identifies specific individuals, and provides only anonymized aggregated data. Employees can trust the system tracks desk occupancy patterns, not personal behavior. Installation favors simplicity, most sensors mount under desks in minutes without drilling, run on multi-year batteries, and connect wirelessly.
For organizations ready to implement accurate, privacy-first desk occupancy monitoring, explore our desk occupancy sensor solutions designed specifically for hybrid workplaces.
Integrated desk booking systems track occupancy through reservation data, app-based check-ins, QR code check-ins, and integration with physical sensors. Employees can view interactive floor maps showing available desks, see where colleagues are sitting, and book nearby workstations. The system automatically releases desks when users don't check in within a specified window, typically 15-30 minutes, eliminating ghost bookings.
Discover how our desk booking system combines occupancy tracking with seamless employee experience features.
Comprehensive desk occupancy monitoring requires tracking multiple interconnected metrics that reveal different aspects of how your space is actually used.
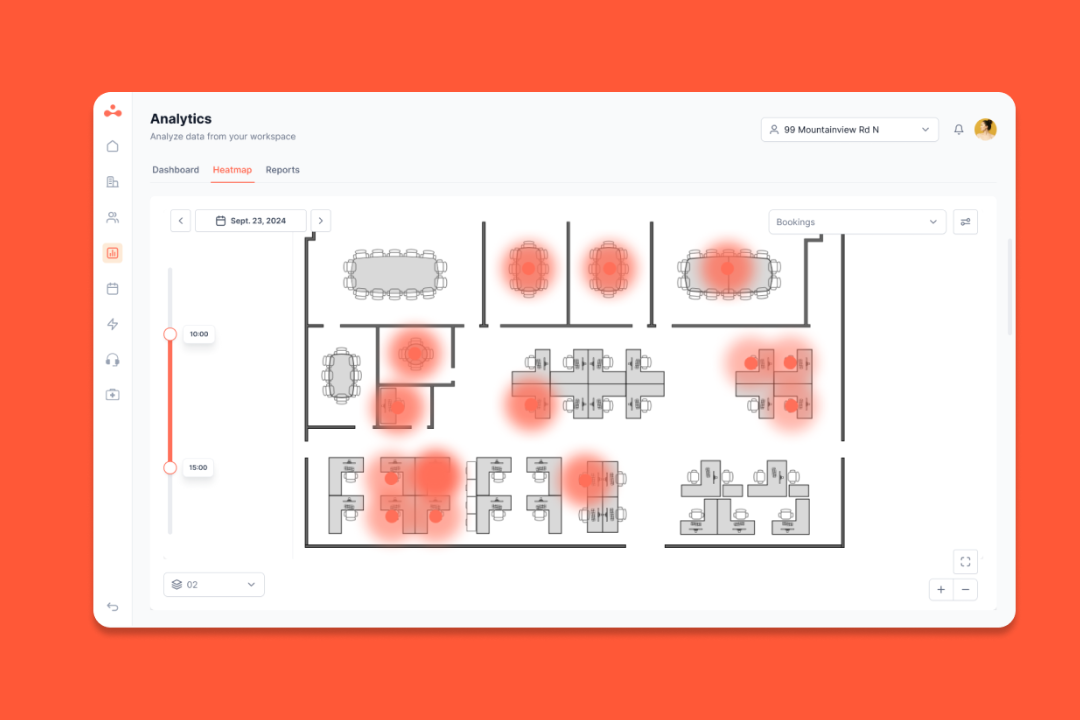
Transform raw data into compelling visual stories through heat maps and interactive floor plans. Color-coded heat maps instantly reveal hot spots where competition for desks runs high and cold zones that consistently remain empty. A floor awash in red during Wednesday afternoons tells you exactly where demand concentrates, while blue areas signal underutilized space ripe for reconfiguration.
These visualizations make complex data accessible to stakeholders who don't want to parse spreadsheets. Executives grasp space utilization issues immediately when they see visual representations rather than rows of numbers. Interactive floor plans allow you to click through different time periods, comparing Monday occupancy against Thursday, or tracking how a recent layout change impacted space usage. We find these visual reports essential for executive presentations and facilities planning discussions.
The Monday and Friday problem plagues nearly every hybrid workplace. These days consistently show 30-50% lower attendance than mid-week peaks, making it difficult to determine appropriate space allocation. Do you right-size for the peaks and accept empty offices on Mondays, or optimize for average attendance and face capacity crunches on Wednesdays? This unpredictability complicates all space planning decisions. Without accurate historical data, you're essentially guessing about future needs, and the impact cascades through decisions about desk counts, meeting room availability, and even cleaning schedules.
Ghost bookings represent one of the most frustrating challenges in desk occupancy management. Employees reserve desks but don't show up, either because plans changed, they forgot to cancel, or they're holding desks "just in case" without firm office intentions. The impact extends beyond wasted space. Other employees see a fully booked floor on the booking system and decide to work from home, even though half those reserved desks will remain empty all day.
Passive occupancy compounds the problem. Someone leaves their laptop and coffee cup at a desk, claiming it as occupied, but spends six hours bouncing between meetings. The desk remains technically occupied but functionally unavailable, the worst of both worlds.
Despite average occupancy rates suggesting adequate space, peak times can leave employees scrambling for available desks. The frustration of commuting to the office only to find no workspace crushes morale and undermines return-to-office initiatives. This shortage connects directly to retention and productivity issues. Employees who repeatedly face space shortages will simply stop coming to the office, defeating the purpose of maintaining space at all. You need buffer capacity, typically 10-15% above peak demand, to handle variations and ensure a positive experience.
When employees can't see which desks are available before arriving, they waste time wandering floors searching for space. Without real time data about desk availability, the entire office experience feels uncertain and frustrating. This lack of visibility represents a major barrier to successful hybrid work adoption and creates unnecessary friction for employees trying to plan their workweeks effectively.

Desk-sharing ratios quantify how many employees share each desk. A 1.5:1 ratio means three employees share two desks, while 2:1 means two employees share one desk. Calculating your optimal ratio requires analyzing attendance patterns, growth plans, and employee work preferences. Industry benchmarks vary significantly by work model. Fully remote-first companies with occasional office access might operate at 3:1 or 4:1 ratios. Hybrid organizations typically target 1.3:1 to 1.8:1 ratios depending on how many days employees work on-site.
The goal is right-sizing your space to match actual usage without creating chronic shortages. Consider factors like team attendance patterns, whether certain teams cluster their office days together. Factor in growth plans, will you hire 20% more people next year? Account for employee preferences, do people strongly prefer specific desk locations or neighborhoods? For detailed guidance on calculating and implementing desk-sharing ratios, see our comprehensive desk sharing ratio guide.
Integrated booking systems solve multiple problems simultaneously by combining employee-facing convenience with powerful backend analytics. Key features to prioritize include:
These features reduce conflict over scarce resources, improve the employee experience, and generate the data you need for informed decision-making.
Activity-based working recognizes that employees need different space types for different tasks. Rather than assigning everyone identical desks, create a variety of environments tailored to specific activities:
Use your occupancy data to inform the right mix of space types. If sensors show collaboration zones consistently full while focus desks remain empty, adjust your allocation accordingly. The data tells you what your employees actually need versus what you assumed they'd want.
Transparent policies prevent confusion and conflict over scarce resources. Create guidelines covering:
The crucial element is communication and change management. New policies only work when employees understand the reasoning behind them and feel the implementation respects their needs. Roll out changes gradually, gather feedback, and adjust based on what you learn.
Treat desk occupancy optimization as an ongoing process rather than a one-time project. We recommend quarterly reviews of occupancy data, examining trends, identifying anomalies, and adjusting policies or space allocation as needed. This continuous improvement approach ensures your workspace evolves with your organization's changing needs.
Recognize seasonal and cyclical patterns in your data. Many offices see decreased attendance during summer months and holiday periods, while certain industries experience busy seasons with higher office presence. Use this knowledge to inform facilities planning and potentially sublease space during predictable low-occupancy periods. Establish employee feedback loops to complement quantitative data with qualitative insights. Sometimes the numbers tell you occupancy is optimal while employees still feel the system isn't working, investigating that gap reveals opportunities for improvement.
You now understand desk occupancy fundamentals and the business case for optimization. The challenge is finding a solution that actually delivers.
That's where elia comes in. We've built a complete workplace management platform addressing every challenge in this guide: privacy-first occupancy sensors for accurate real time data, integrated desk booking to eliminate ghost bookings, analytics dashboards for actionable insights, and workplace automation for seamless operations.
What sets elia apart? We're an all-in-one platform with native Microsoft and Google integrations, ISO 27001 certification, and simple setup that won't burden your IT team.
Ready to stop guessing about your office space needs? Book your demo with elia today and create a more efficient, employee-friendly workspace.
Answers to Your Common Queries